Dividend Value Builder Newsletter
– Discover, Compare, and Evaluate Dividend Stocks Without Emotional Bias –
(Intrinsic Value Analysis For Over 300 Stocks)
Intrinsic Value Stock Analysis – My Formula
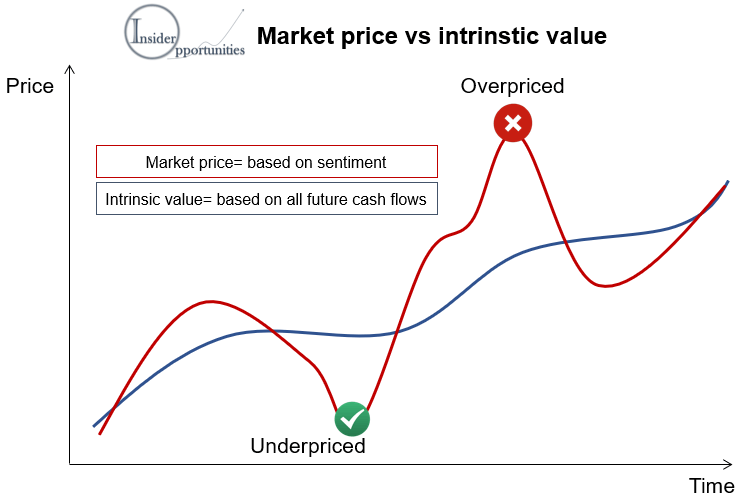
The purpose of intrinsic value stock analysis is to identify the fundamental value of a company, compare that value to the current stock price, and identify the margin of safety for the company stock.
A common mistake of investors is the failure to differentiate between a great company and a great stock. It’s fairly easy to identify great companies; however, many of them are not great stocks.
Selecting stocks for purchase can be difficult and time consuming. The Dividend Value Builder provides a time saving approach to discover, compare, and evaluate stocks without emotional bias.
My intrinsic value / margin of safety analysis eliminates the companies with unfavorable stock prices. This allows our members to concentrate on stocks that offer an adequate margin of safety given the amount of risk.
How To Use The Dividend Value Builder
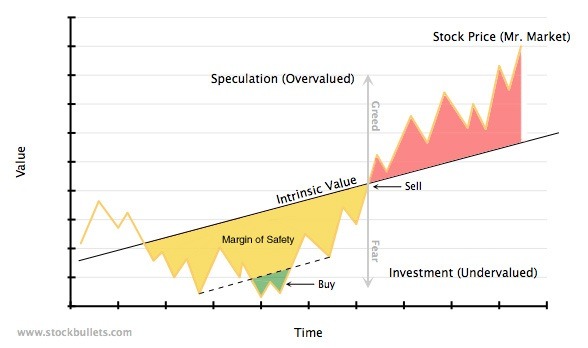
Our objective is to find dividend stocks that can provide above average rates of return and which will contribute to lowering overall portfolio risk. The best and safest approach is to add stocks that are priced below the real or intrinsic value of the company (therefore providing a margin of safety).
Intrinsic value is the estimated value of an investments future cash flow, expected growth, and risk. The difference between the current stock price and the intrinsic value is the margin of safety.
My intrinsic value analysis concentrates on cash flows; particularly cash flow from operations and free cash flow. Unlike earnings, cash flow metrics can’t be manipulated or distorted.
Each Dividend Value Builder Newsletter provides the following for over 300 stocks twice a month:
– Target Buy Price
– Target Sell Price
– Estimated Intrinsic Value,
– Estimated Margin of Safety,
– Projected 5 Year Total Return (annualized),
– Risk / Stability Grade (Macro & Micro)
– Quality Grade (Specific to Company)
Intrinsic Value Stock Analysis – My Formula
I use an absolute price/cash flow model with the purpose of determining a fair value price for a stock.
Each stock is evaluated and graded for risk/stability (macro & micro), and quality. The 5 main quality inputs are earnings growth rate, dividend yield, financial risk, business risk, and predictability of cash flows.
Dividend Yield
Historically approximately one-half of long term stock market returns are delivered through dividends. Dividends are real, they can’t be faked or brought about by fraudulent accounting.
If a stock has a low dividend yield I want to know if its because the stock is overpriced or if and why the company is not returning enough to shareholders. Does the company have the ability to grow the dividend?
If a stock dividend yield is high I want to have a clear understanding of what negatives are causing the price of the stock to be low. Does the high yield compensate the shareholder for whatever risks are in the price of the stock?
Financial Risk Analysis
Here are some of the factors considered to assess the financial risk of an individual company:
Altman Z-Score:
The Altman Z-Score is a formula of 5 basic financial ratios to help determine the financial health of a company. In particular, it is a probabilistic model to screen for bankruptcy risk of a company.
The importance of not losing all of your investment cannot be overstated. The Altman Z-Score will help us avoid companies that may be headed towards bankruptcy.
Free Cash Flow Payout Ratio
Forward Dividend Per Share / Free Cash Flow Per Share (TTM)
We analyze the dividend payout ratio based on cash flow instead of accounting earnings. It’s actual cash flow generation that provided the company the ability to pay the dividend.
Dividend payout ratios provide important data on the amount being returned to shareholders and the company’s capacity to maintain and increase the dividend.
Net Financial Debt to Total Assets Ratio
Net Financial Debt = Financial Debt (Long Term Debt + Current Portion Debt + Dividends Payable + Notes Payable) – (minus) Cash and Short-Term Investments
Comparing Net Financial Debt to Total Assets tells us how much the corporation’s assets are leveraged after accounting for their liquid assets. Net financial debt is more accurate and more important than ever because of the corporate trend to leave cash overseas and borrow domestically.
The higher the ratio the more leveraged the company and the greater the probability of adverse conditions affecting the dividend in a negative manner. A negative number means the company has more cash than debts. Everything else being equal, these companies carry less risk of dividend cuts.
Credit Rating
A corporate credit rating is an assessment of a company’s ability to pay the interest and principal on its debt obligations. Since these obligations are usually senior to dividend payments it’s important to understand the basic creditworthiness of a company.
A company with a non-investment grade credit rating should certainly have “D” or “F” risk/stability grade and require a large margin of safety to compensate for the risk.
Business Risk Analysis
Gross Profitability Ratio = Gross Profit to Total Assets:
Gross Profit to Total Assets = (Revenue – Cost of Goods Sold) / Total Assets
Gross Profitability Ratio is a profitability and efficiency ratio researched by Robert Novy-Marx to identify stocks that outperform the market in the long run. It measures the amount of profit a company generates for each dollar of total assets.
We want to buy stocks at bargain prices, but ideally we want to identify quality companies. The Gross Profitability Ratio uses gross profit (the basics of what a company does) and matches it with the amount of assets required to produce the profit. This is a high probability metric for indicating companies with sustainable competitive advantages .
A high Gross Profitability Ratio is evidence that a company has sustainable competitive advantages. Otherwise competition would enter their market and lower their profits. The fact that they have above average profits means they are able to achieve a premium or favorable position over their competitors.
Free Cash Flow / Total Assets
This is another profitability and efficiency ratio at a different level of analysis. It’s another measure of the quality of management and their ability to generate cash flow with their investments (assets).
Piotroski F-Score:
The Piotroski F-Score is a 9 point ranking system with an incredible performance record of finding investments with good fundamentals and eliminating stocks of weak companies.
A pass is worth 1 point and fail worth (0). Here are the components grouped in order: Profitability, Capital Structure, and Operating Efficiency.
1. Net Income > 0
2. Cash Flow From Operations > 0
3. Higher ROA Than Previous Period
4. CFO > NI
5. Decline in Long Term Debt
6. Higher Current Ratio Than Previous Period
7. Number of Shares of Stock < Than Previous Period
8. Higher Gross Margin Than Previous Period
9. Higher Asset Turnover Than Previous Period
Note that 6 of the 9 components are trending metrics. This makes the Piotroski F-Score a volatile but sensitive indicator of a company’s current direction.
Low scores could be an early indicator of possible future problems. Conversely, high f-scores would mean a low probability of a dividend cut.
The F-Score has a proven record as an indicator for a company’s future stock price performance. Groups of stocks with a 7, 8, or 9 far outperform groups of stocks with a 0, 1, 2, or 3.
Return on Invested Capital (ROIC)
The Return on Investing Capital (ROIC) ratio measures the return achieved on equity and debt capital invested by the entity. For investors looking for quality this is one the most popular and valuable metrics.
ROIC is one of my earnings quality metrics because it measures a company’s efficiency at allocating capital to produce profits.
Growth Rate Estimate
The annual EPS/Cash Flow long term (5 years +) growth percentage estimate.
Cash Flow From Operations
The purpose of defining Cash Flow From Operations is to isolate and focus on the well-being of the day-to-day operations or core business of the company. It is the lifeblood of the organization, the core operations of the business, making it one of the most important metrics an analyst can examine.
We concentrate on cash flows because, unlike earnings, they can’t be manipulated.
Calculating Intrinsic Value – My Formula
(The following is a simplified explanation. If you’re interested in a detailed explanation and examples of how this works I recommend Vitaliy N. Katsenelson’s book “Active Value Investing”. I use a modified version of his model, which you can find on pages 139 – 156.)
1. Estimate Cash Flow From Operations Per Share out into the future. Estimates beyond 1 year should be discounted (I usually use 12% but may adjust to specific conditions – you might choose a different number).
2. Calculate a CFO multiple. I assume an average company with zero growth and no dividend would trade with a P/CFO multiple of 6. I make two adjustments; 1) for growth by adding 0.65 to the multiple for each percentage of estimated growth rate (growth rate x 0.65) and 2) by adding 0.65 to the multiple for each percentage point in dividend yield (dividend yield x 0.65).
Example: A company with an estimated growth rate of 6% and a 3% dividend yield would have a CFO multiple of 11.85. (6 + 3.9 + 1.95 = 11.85 CFO multiple).
(Note: You might choose different adjustments. Katsenelson gives a high adjustment rate for dividend yield versus estimated growth rate. I believe his argument is valid; I choose to give equal weight. While it’s true the dividend is received now, it’s also true that future growth can grow exponentially through compounding.)
3. Make appropriate adjustments to the CFO multiple based on company financial risk, business risk, and cash flow predictability. Put together this is my Quality Grade. The adjustment are based on the homework done and described above.
Examples:
A company with above average risk might have an adjustment of .80 (11.9 x 0.8 = 9.5)
A company with average risk would have an adjustment of 1.0 (11.9 x 1.0 = 11.9)
A company with below average risk might have an adjustment of 1.2 (11.9 x 1.20 = 14.3).
There is no maximum adjustment down to account for risk but adjustments higher should have some limits (Katsenelson uses a 30% limit).
4. Multiply the risk adjusted CFO multiple by the discounted estimated cash flow from operations per share for estimated intrinsic value.
5. The difference between the estimated intrinsic value and the current price is the margin of safety.
6. Assign a risk/stability grade. The quality grade assigned to the company carries the largest weight in determining my risk/stability grade.
I would never increase the risk/stability grade above the company quality grade, but there are a fair number of circumstances where I lower the risk/stability grade below the company quality grade. These would be cases where outside forces are causing uncertainty beyond the specific qualities of a given company.
Our estimated intrinsic value adjusted by our risk/stability grade determines our target BUY price as well as our target SELL price.
– Target BUY Price (based on margin of safety in relation to intrinsic value).
(Required Margin of Safety Adjusted by Risk Stability Grade:
A = 10%, B = 20%, C = 30%, D = 40%, F = 50%)
Our target BUY price is risk adjusted. In other words, riskier stocks require a larger margin of safety based on the Risk / Stability grade for the stock.
(Note: Just because a stock is at or below its BUY target price doesn’t mean it’s appropriate for every portfolio.)
– Target SELL price (based on margin of safety in relation to intrinsic value).
(Allow Overvaluation Adjusted by Risk Stability:
Grade: A = 20%, B = 15%, C = 10%, D = 5%, F = 0%)
Risk / Stability Grade:
The Risk Stability Grade is a classification of the overall environment (macro & micro) of the given company including the economy, company sector & industry, quality grade, competitive advantages (or lack of), perceived moat, etc. The Risk Stability Grade determines the required margin of safety for each stock.
A grade indicates a quality company with a strong balance sheet, high earnings quality, and a supportive business environment. These stocks require the slimmest margin of safety within the stock universe.
B grade indicates a company with a reasonably good balance sheet and earnings quality along with a stable business environment. The margin of safety required should be greater than stocks with an A grade but less than the average stock.
C grade indicates a company with a sufficient balance sheet, at least average earnings quality, and a reasonably stable business environment. The margin of safety required is greater than A & B stocks, but less than D & F stocks.
D grade indicates a company with a challenging business environment and/or company quality issues that could affect its stability and long term risks. D rated stocks should require a large margin of safety when purchased.
F grade indicates a company or business environment with significant issues that are currently affecting its stability and long term risks. Require an extremely large margin of safety for F rated stocks when purchased.
Note:
Risk adverse investors should concentrate on stocks with a Risk / Stability Grade of A, B, or C. Investors with diversified portfolios seeking above average returns would include stocks with a D or F grade.
Quality Grade:
The objective is to evaluate the overall quality unique to each individual company and their ability to provide returns to shareholders. Financial and Business Risk are assessed. Factors include dividend policy, earnings & cash flow metrics, growth estimates, condition of the balance sheet (credit rating, Altman Z-Score, debt ratios, etc.),and profitability ratios (Gross Profitability, Piotroski F-Score, Return on Invested Capital (ROIC), etc.)
A grade is reserved for companies with the highest quality. These companies have advantages that may help them prosper and would be the most likely to survive adverse conditions or unpredictable events.
B grade indicates a quality company. These companies have a better than average probability of thriving under good conditions and surviving adverse conditions or unpredictable events.
C grade indicates an acceptable or average quality company. These companies have a reasonable probability of doing well under good conditions and survive most adverse conditions or unpredictable events.
D grade indicates above average financial risk and/or poor earnings quality. These companies carry higher than average specific company risk.
F grade indicates serious issues concerning financial risk and/or poor earnings quality. These companies carry significant specific company risk. Investors should complete comprehensive due diligence before investing.
Conclusion
Ideally we want to find companies whose stock price offers an opportunity to purchase when the odds are heavily in our favor. In other words, we look for bargain prices. The Dividend Value Builder allows us to examine the appropriate metrics without the emotional bias that we all have when looking for stocks we “like”.
Many times the most “unpopular” stocks are the best opportunities because they have a favorable price. We initiate our research with “blinders” on. Our quantitative analysis allows us to discover, evaluate, and compare stocks without emotional bias.
My Dividend Value Builders Newsletter will assist you in finding the best stock opportunities for your portfolio!
Explore our affordable Membership Plans here.
Minimize Large Portfolio Drawdowns
Invest With Confidence in Less Time - Manage Your Portfolio Without Behavioral Errors
Disclaimer
While Arbor Investment Planner has used reasonable efforts to obtain information from reliable sources, we make no representations or warranties as to the accuracy, reliability, or completeness of third-party information presented herein. The sole purpose of this analysis is information. Nothing presented herein is, or is intended to constitute investment advice. Consult your financial advisor before making investment decisions.