Dividend Value Builder Newsletter
– Discover, Compare, and Evaluate Dividend Stocks Without Emotional Bias –
(Intrinsic Value Analysis For Over 300 Stocks)
Piotroski F-Score Stock Screen

The Piotroski F-Score Stock Screen is a value investing strategy to identify stocks of companies with good fundamentals and eliminate stocks of weak companies. The goal is to avoid value traps and only invest in real value stocks.
Value stocks are often values because the companies have encountered a challenge. Some companies will have the ability to overcome those challenges and others will not.
Joseph Piotroski developed a 9 point stock screen ranking system which has produced an incredible performance record of finding quality investments. You can read his entire paper here: Value Investing: The Use of Historical Financial Statement Informatiion to Separate Winners from Losers.
The American Association of Individual Investors (AAII) calculates a performance history of over 22% per year from 2003 – 2017 for the strategy. However, the strategy has underperformed in 2018, 2019, and 2020.
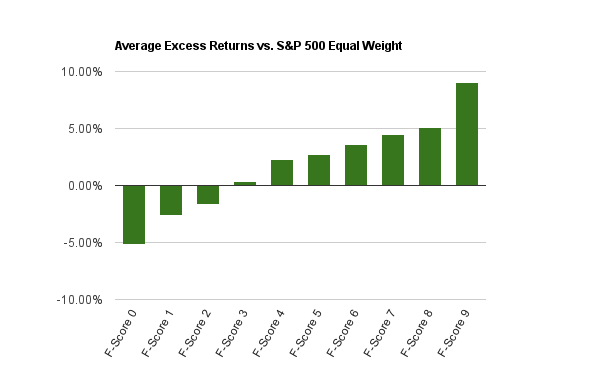
George at Fat Pitch Financials does a great service for investors by completing backtest on various strategies. His Piotroski Score Backtest shows some amazing results! Check out the above graph.
Every total point score starting from 0 to 9 demonstrates an improvement in returns as the total points increase. In addition, total points of 0, 1, and 2 have negative returns. These results indicate that the Piotroski F Score is a bonafide strategy and a valuable stock screen.
How the Piotroski F-Score Stock Screen Works
The F-Score Test examines 9 tests in three areas: profitability, capital structure, and operating efficiency. Each test is given either 0 points for a fail or 1 point for a pass. All 9 tests can be derived from company financial statements.
Piotroski found that companies with 8 or 9 total points greatly improved the probability that the company had the ability to overcome challenges and eventually grow its stock price. Here are the 9 tests in the 3 areas:
Profitability (4 points)
Return on Assets
Return on assets (ROA) is net income before extraordinary items divided by total assets. If ROA is positive award 1 point; if negative, no points.
Cash Flow from Operations
Cash Flow From Operations is the cash inflows and outflows of a company’s core business operations. One point is awarded for positive cash flow from operations and none if it is negative.
Direction of Return on Assets
Did the return on assets increase this year over last year? Is so, award 1 point; if not, no points.
Accrual Accounting Check
Does the cash from operations exceed net income before extraordinary items? If yes, award 1 point, if not, no points.
Capital Structure (3 points)
Direction of Leverage
Did the long term debt to total assets ratio increase or decrease from the year before? If leverage decreased award 1 point; if it increased, no points.
Direction of Liquidity
Did the current ratio (current assets divided by current liabilities) increase or decrease from the prior year? If it increased, award 1 point; if it decreased, no points.
Issue Stock
When a company issues stock it dilutes the present shareholders stake and may indicate the company is unable to raise sufficient capital from operations. If the company has not issued stock in the past year award 1 point; if it issued stock, 0 points.
Operating Efficiency (2 points)
Direction of Margin
If the gross margin ratio has increased (year over year) that is a positive sign, award 1 point. Falling margins would be a warning sign, no points awarded.
Direction of Asset Turnover
An increase in asset turnover (sales divided by assets at the beginning of the year) from one year to another would indicate greater efficiency. Award 1 point for a higher asset turnover ratio than the previous year; 0 points if it has decreased.
Using the Piotroski F-Score Stock Screen
There is no single magic formula that will give you a certain answer to whether you have chosen the right stock. The Piotroski F-Score has a proven record of increasing the probability of eliminating weak companies and identifying the stocks of companies with good fundamentals.
One of the aspects I like about the Piotroski score is that it is sensitive to company trends. We want an early warning to potential problems when it comes to dividend safety. This is just one of several valuable approaches to using the Piotroski F-Score.
Additional Reading:
Intrinsic Value Stock Analysis – My Formula
Minimize Large Portfolio Drawdowns
Invest With Confidence in Less Time - Manage Your Portfolio Without Behavioral Errors
